Documentation Index
Fetch the complete documentation index at: https://motiadev-docs-verdict-review-plan.mintlify.app/llms.txt
Use this file to discover all available pages before exploring further.
Goal
Make your iii application fully observable: correlate every log entry to the exact trace that produced it, inspect execution timelines to find bottlenecks, and optionally export all telemetry to third-party tools like Grafana, Jaeger, or Datadog.The iii Logger
Every iii SDK ships aLogger class that emits logs as OpenTelemetry LogRecords. Each log call automatically captures the active trace ID and span ID, linking the log entry to the distributed trace that produced it.
| Approach | Where it appears | Trace correlation |
|---|---|---|
console.log("Order created") | stdout only | None |
print("Order created") | stdout only | None |
tracing::info!("Order created") | stdout only | None |
logger.info("Order created", { orderId }) | stdout, iii Console, OTLP backends | Automatic — linked to the active trace and span |
Trace-correlated logs in iii Console
When you use the iii Logger, every log entry is attached to the trace that was active when the log was emitted. In the iii Console, clicking a trace in the waterfall chart opens a detail drawer. The Logs tab shows every log entry from that exact execution — with severity, timestamp, message, and any structured data you attached.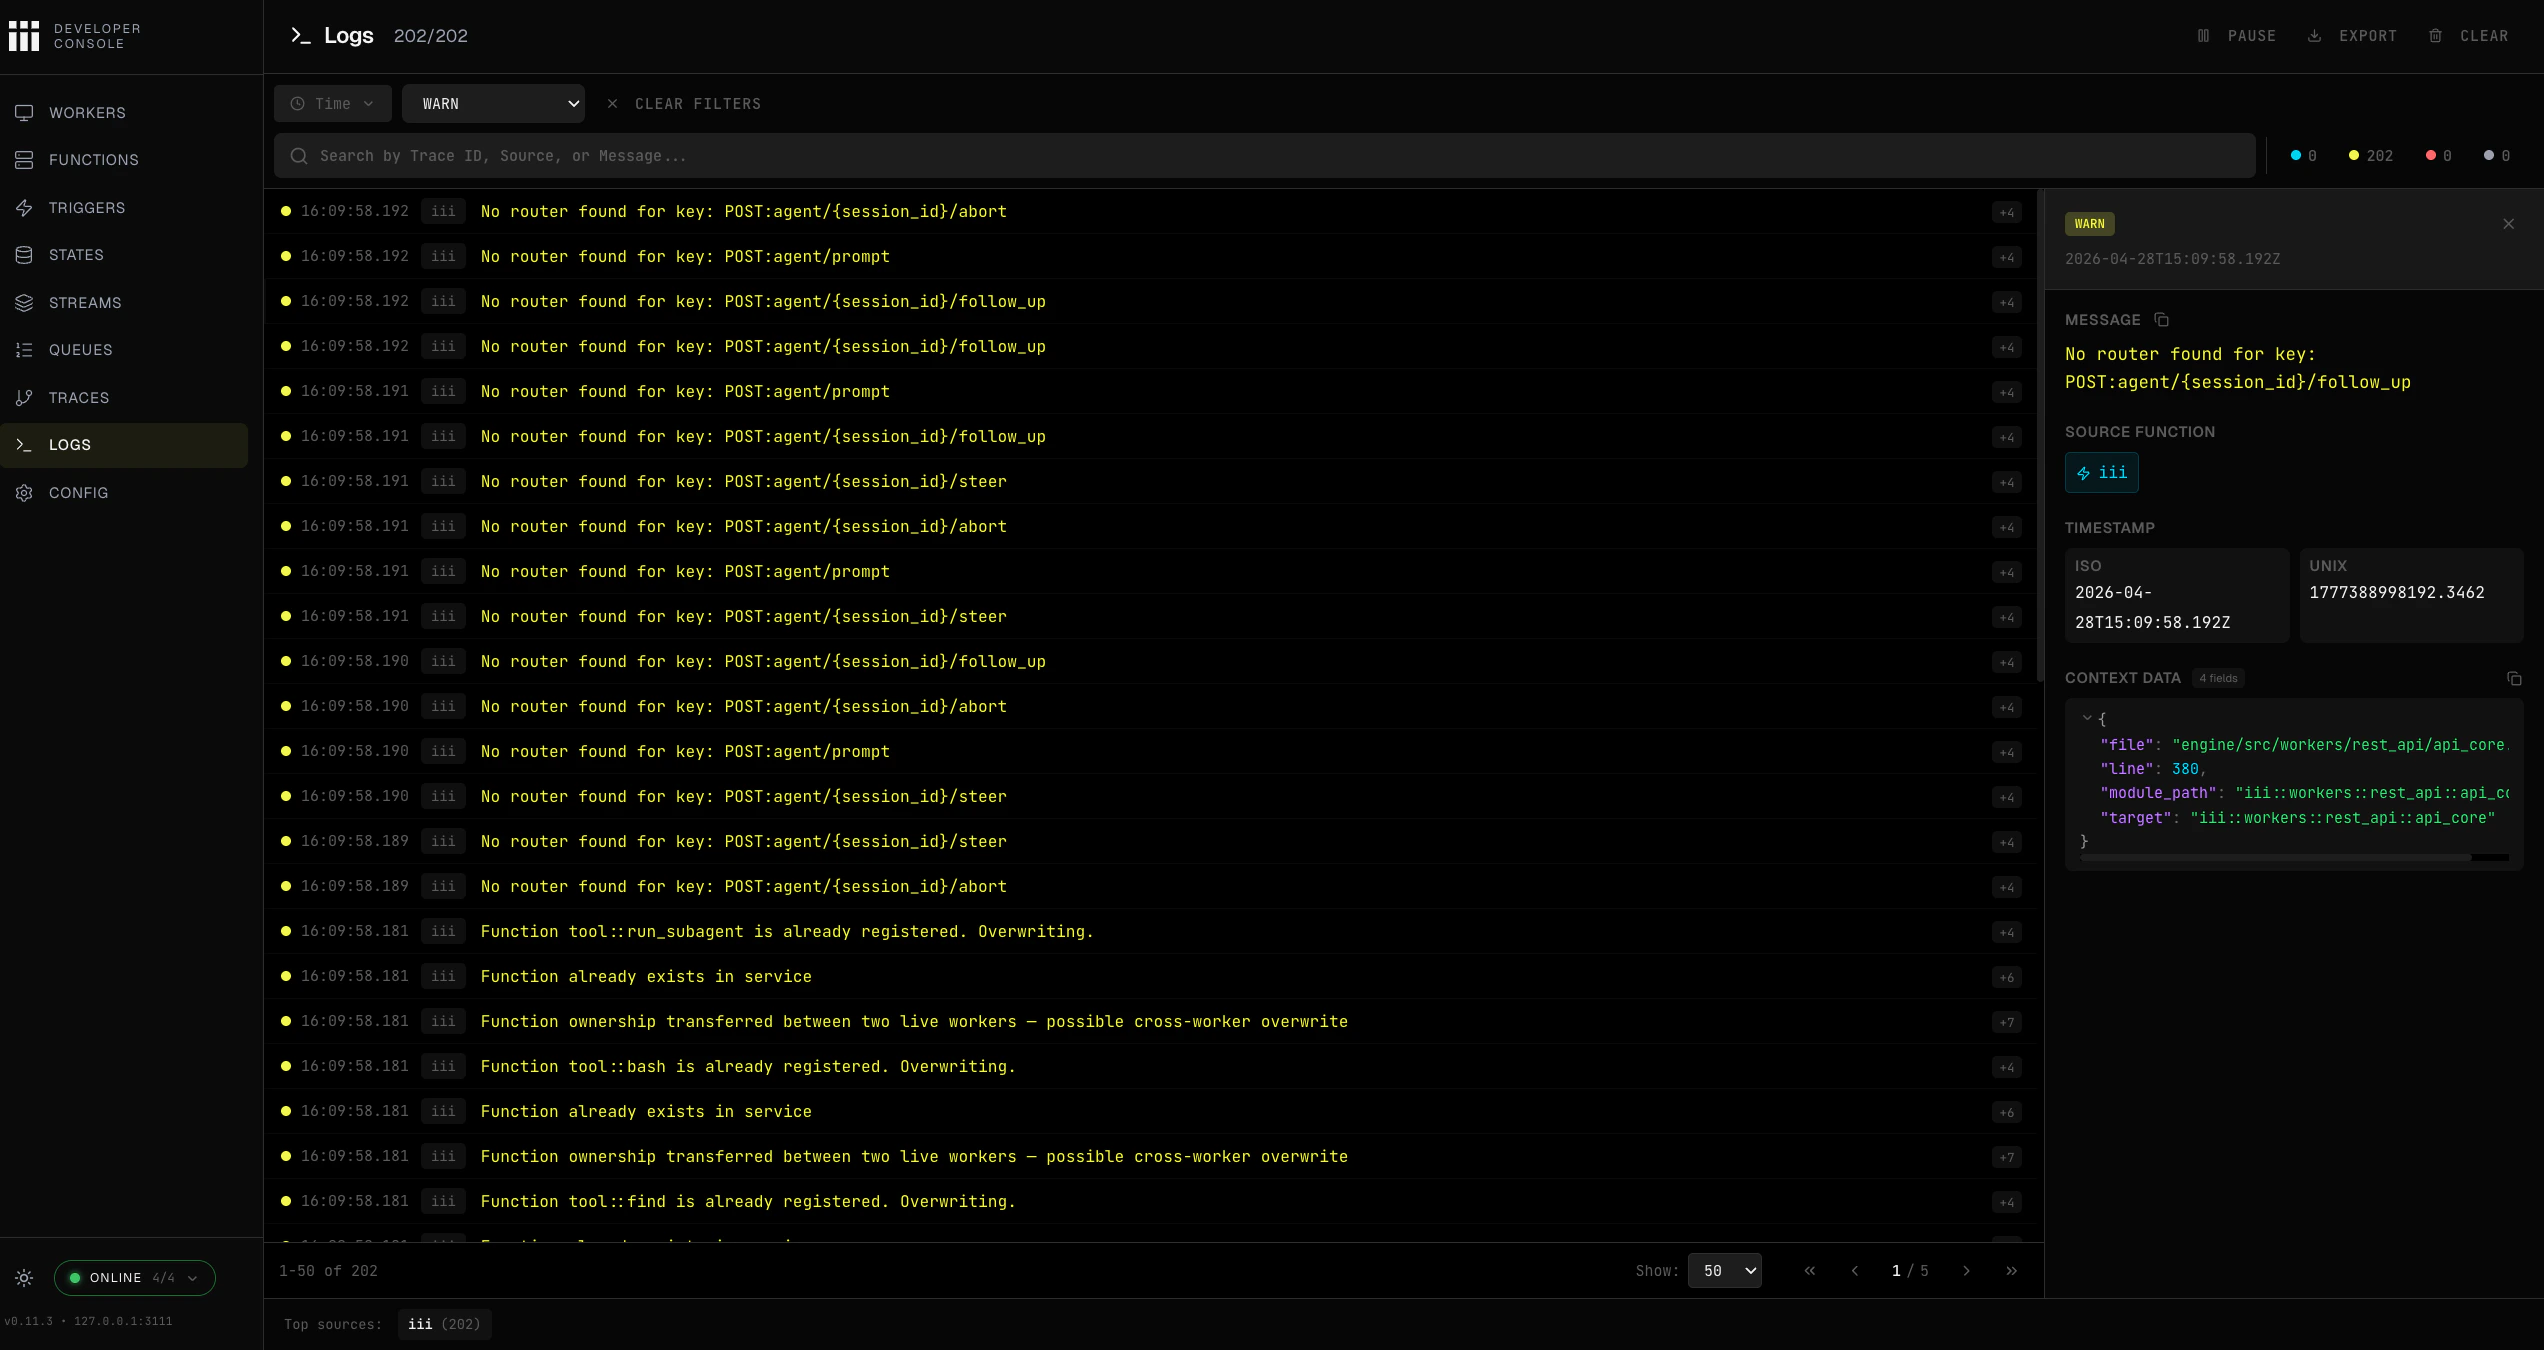
Using the Logger
Import and instantiate
Create a
Logger instance in your function handler. No configuration is required — trace context is injected automatically.- Node / TypeScript
- Python
- Rust
Attach structured data
Pass a second argument with key-value data. Structured data becomes filterable attributes in the iii Console and in any OTLP-compatible backend.
- Node / TypeScript
- Python
- Rust
Prefer key-value objects over string interpolation. Structured fields let you filter, aggregate, and build dashboards — string-interpolated messages do not.
Logger API reference
All three SDKs expose the same four methods:| Method | Node / TypeScript | Python | Rust |
|---|---|---|---|
| Info | logger.info(msg, data?) | logger.info(msg, data=None) | logger.info(msg, Option<Value>) |
| Warning | logger.warn(msg, data?) | logger.warn(msg, data=None) | logger.warn(msg, Option<Value>) |
| Error | logger.error(msg, data?) | logger.error(msg, data=None) | logger.error(msg, Option<Value>) |
| Debug | logger.debug(msg, data?) | logger.debug(msg, data=None) | logger.debug(msg, Option<Value>) |
console.* (Node), Python logging (Python), or tracing::* (Rust) — your logs still appear in stdout.
Configuring observability
The iii engine’s Observability worker (iii-observability) controls how traces, logs, and metrics are collected and exported. There are two main configurations depending on your environment.
Local development
For local development, use thememory exporter. Traces and logs are stored in the engine’s memory and can be inspected through the iii Console. This is the simplest setup and requires no external infrastructure.
iii-config.yaml
| Field | Purpose | Default |
|---|---|---|
exporter | Where to send traces: memory, otlp, or both | otlp |
memory_max_spans | Max spans kept in memory | 1000 |
logs_enabled | Enable structured log storage | true (always initialized) |
logs_max_count | Max log entries kept in memory | 1000 |
logs_console_output | Also print logs to the terminal via tracing | true |
With
exporter: memory, all data lives in the engine process. This is ideal for development — no collector, no database, just start the engine and open the console.Exporting to third-party tools
For production or when you want to send telemetry to an external system (Grafana, Jaeger, Datadog, or any OTLP-compatible collector), use theotlp exporter with an endpoint.
iii-config.yaml
exporter: both:
iii-config.yaml
The
endpoint field can also be set via the OTEL_EXPORTER_OTLP_ENDPOINT environment variable. See the Observability worker reference for the full list of configuration fields and environment variable overrides.Viewing Logs in iii Console
Once you’ve instrumented your code with the Logger, view trace-correlated logs in the iii Console.See Use the Console for step-by-step instructions on navigating traces and viewing span details.
trace_id, click it to jump directly to the corresponding trace.
For the full console feature set, see the Console reference.
Result
Your iii application is now fully observable:- Structured logs are correlated to distributed traces automatically — no manual wiring.
- Local visibility is available through iii Console with the
memoryexporter — no external infrastructure needed. - Third-party export sends traces, logs, and metrics to any OTLP-compatible backend via the
otlporbothexporter. - Bottleneck identification is possible through waterfall, flame graph, and service breakdown views in the console.
Next steps
Console
Full iii Console feature reference
OpenTelemetry Integration
Custom spans, metrics, and telemetry utilities
Observability Worker
Full configuration reference for traces, logs, metrics, alerts, and sampling
Observability Example
End-to-end multi-step workflow with trace correlation